
-

Ryan O’Hanlon
Ten games in, and it’s just as we all suspected. Arsenal, Manchester City and Liverpool were the clear top three heading into the Premier League season, and Arsenal, Manchester City and Liverpool are the current top three.
In other words, you could’ve taken a two-month nap the night before the Liverpool vs. Bournemouth season-opener and you wouldn’t have really missed anyth– OK, fine. Beyond the top three in the table, pretty much nothing has gone to plan.
Man City lost two of their first three matches. Liverpool won five in a row and then lost four in a row after they lost four matches — total — last season. Bournemouth, who lost 75% of their backline to big-money transfers to big-name clubs over the summer, have the same number of points as Liverpool, as do newly promotes Sunderland, who finished fourth in the Championship last season.
The points gap between Arsenal in first and City in second is the same size as the gap between City and Brentford, who are 12th. One spot lower, in 13th? Newcastle, who are currently ahead of Barcelona and Liverpool in the Champions League standings.
And after two straight years of all three promoted sides immediately getting relegated, instead it’s West Ham, Nottingham Forest and Wolves who comprise the bottom three. They’ve combined for three wins and four total manager firings; every other team in the league has at least three wins, and they all have the coach who was on the sideline when the season started.
Now, the 10-game mark is when we’re supposed to start to get a clear idea of what’s happening, when the random swings of the first few months of soccer start to coalesce into something real. At least, multiple studies have found that a team’s collective performance, as measured by a number of different team-strength metrics, starts to become predictive of that team’s future performance right around now.
If that’s true, then what can the wild season so far tell us about the rest of the season to come? Here are our projections for the final 28 matches, and our projected final table positions for all 20 Premier League teams.
– Ranked: Top 50 players of Premier League season
– How Arsenal can be stopped from winning the league
– 15 next-generation stars to keep an eye on
How we’re predicting the rest of the season
Rather than doing a much more complex and perhaps much more mathematically sound projection, this approach will be something simpler: (1) because it’s easier to understand, and (2) because that makes it easier to glean insights from what the projection tells us.
I’ve written about this so many times that I fear I will soon develop a very specific kind of hand arthritis from the repeated motion of my fingers toward these letters, but my favorite single-number to project future team performance is what I call “adjusted goal differential.” This comes from a study by former AC Milan data researcher Ben Torvaney, which discovered that a blend of 70% expected goals and 30% actual goals better predicted future point totals than either goals or xG alone or any other blend of the two.
Knowing that, I then looked at the relationship between a team’s adjusted goal differential after 10 games and their points won over the final 28 matches. Based on data from the past 10 Premier League seasons, a team with a neutral adjusted goal differential after 10 matches would be expected to win 1.39 points per game for the rest of the season. And then every goal increase of adjusted goal differential increases the point per game expectation by 0.47 points.
Of course, 10-game performance can’t tell us everything; otherwise, we could just shut up shop right now and give these guys seven months off until the men’s World Cup.
And, well, there is one number that’s even more powerful in predicting future performance than this blend of goals and expected goals: how much teams pay their players. Even more so than the 10-game performance horizon, the correlation between player wages and team performance has been heavily studied. Most recently, analyst Paul Johnson has looked at how the estimated player values on Transfermarkt can predict how many points a team wins in a season. He found, among other things, that a 10% increase in a team’s value increases a team’s point total in a season by about a point and a half.
Now, neither of these numbers can tell us everything, but I’m using them because there’s an intuitive logic to each one. Adjusted goal difference acknowledges the importance of creating better chances than your opponent as the main driver in team success, but it also accounts for the fact that sometimes teams play differently after a goal is scored and it also picks up some of the stuff for which xG models can’t fully account.
And then market values are just a proxy for talent. Even the best managers will tell you that player quality is the main driver of team performance. But sometimes a bunch of great players play poorly at the same time, or a bunch of good players get injured at the same time or a talented group of players needs more time to figure out how to play together. Adjusted goal differential wouldn’t account for any of this, but we can all agree that these things happen. The market value value input at least attempts to account for this.
Finally, to figure out how to weigh each input, I looked at betting projections for season point totals. Given the financial incentives at play and the continued, insanely profitable existence of sports books, these are going to be the most accurate publicly available “projection systems.” I then chose whatever weight brought these projections closest to being in line with the markets: 64% transfer values and 36% adjusted goal differential.
With that, here is how the Premier League season is projected to finish:
• Projected points total: 79.3
• Projected rest of season total (rank): 54.3 (1st)
• Market value (rank): €1.31B (1st)
• Adjusted goal differential (rank): +1.28 (1st)
This one is simple: They’ve been the best team, they have the best roster, and they have a six-point lead on second place. Per ESPN Bet, their title odds are minus-230, or an implied percentage of around 70%.
If that point total seems low, it’s because the projections in a model like this are always going to be conservative. The teams toward the top and bottom of these projections will likely have more points than what you’re seeing here.
• Projected points total: 68.6
• Projected rest of season total: 52.6 (2nd)
• Market value: €1.21B (2nd)
• Adjusted goal differential: +0.83 (2nd)
This one, too, is simple: They’ve been the second-best team, they have the second-best roster, and they’re currently in second place.
When Erling Haaland scores, they’ve won six, lost one and drawn one. When Haaland doesn’t score, they’ve lost twice. That, also, is simple.
• Projected points total: 66.2
• Projected rest of season total: 48.2 (3rd)
• Market value: €1.15B (3rd)
• Adjusted goal differential: +0.46 (5th)
Could this be the first team that actually are better against better teams? At the very least, there has, so far, been a pretty clear correlation between the number of long balls their opponent attempts and how well Liverpool play.
In one of Liverpool’s better games of the season this past weekend, Aston Villa played just 12% of their passes long — the lowest proportion of any Premier League opponent. Will either of their next two opponents, Real Madrid and Manchester City, try to exploit this apparent weakness?
• Projected points total: 65.1
• Projected rest of season total: 48.1 (4th)
• Market value: €1.14B (4th)
• Adjusted goal differential: +0.48 (4th)
Chelsea both manage to be underrated and overrated here. The former is because they’ve been given three red cards this season and thus played a large chunk of the campaign with fewer players than their opponent. And the latter is because they have such a large roster, and market value doesn’t normalize each team to a consistent number of players.
That said, it all cancels out in these projections, which leave them pretty much even with Liverpool in the race for third place.
• Projected points total: 59.6
• Projected rest of season total: 42.6 (5th)
• Market value: €921M (5th)
• Adjusted goal differential: -0.04 (12th)
This one shocked me. Not necessarily because Tottenham are fifth. They have as many points as Chelsea, and those points aren’t going anywhere. But rather, I was shocked that they’re expected to have the fifth-most points from now until the end of the season. I mean, what the heck is this? Spurs played this game at home!
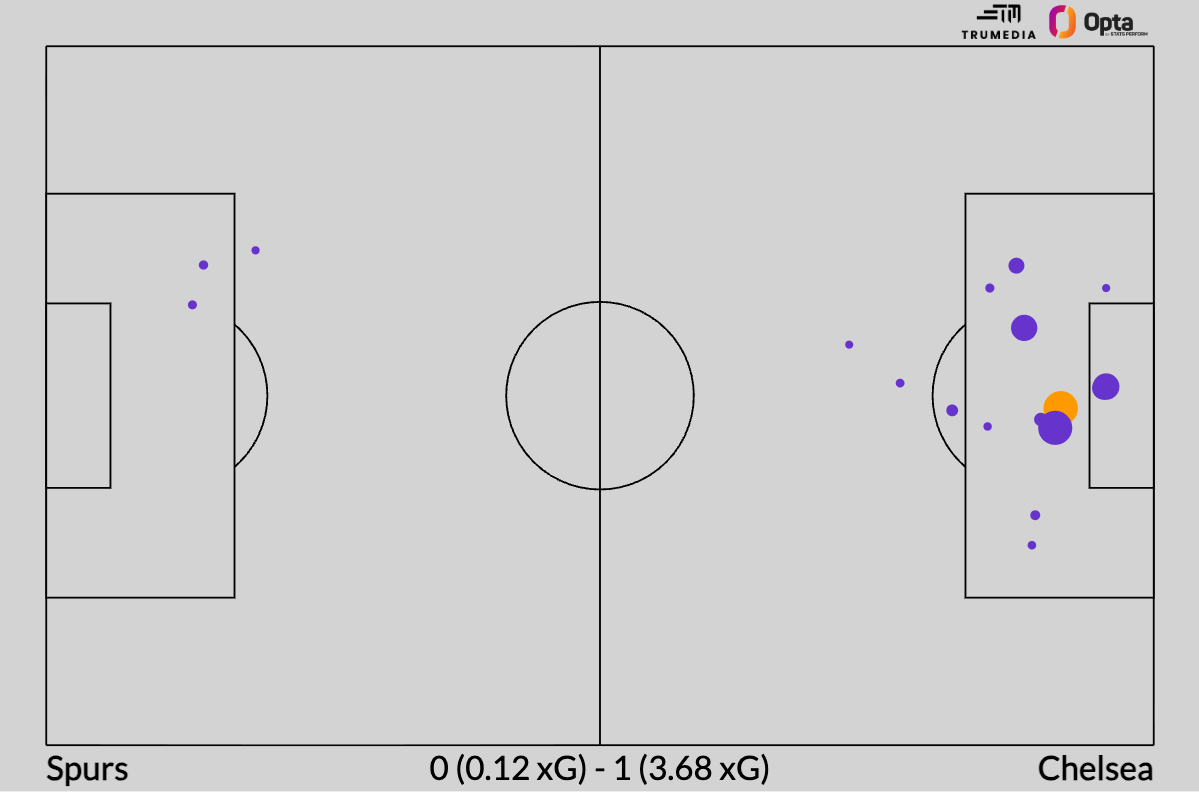
Maybe their roster is more talented than I’m giving it credit for, but this team is good at set pieces, they have a good keeper — and that’s about it.
• Projected points total: 58.0
• Projected rest of season total: 41.0 (7th)
• Market value: €730M (7th)
• Adjusted goal differential: +0.19 (8th)
While I didn’t like their transfer window in terms of increasing their chances of eventually winning another Premier League title, I did think it made them better in the short term. A sixth-place finish would be a nine-spot improvement on last season.
• Projected points total: 56.2
• Projected rest of season total: 38.2 (10th)
• Market value: €448M (12th)
• Adjusted goal differential: +0.15 (9th)
• Projected points total: 55.4
• Projected rest of season total: 39.4 (8th)
• Market value: €485M (11th)
• Adjusted goal differential: +0.59 (3rd)
We’re taking Bournemouth and Palace together because Bournemouth are higher in the table, but Palace are the better team. From a “Can somebody new crack the top five?” perspective, you would rather see the better team be the one with more points already in the bag. And Palace have a better adjusted goal differential than everyone other than Arsenal and City, but they’re two points and five spots behind Bournemouth in the table.
Maybe we get lucky and the points haul lets Bournemouth hang around while Palace’s performances start to match their results better. I’m not convinced that these teams aren’t better than United and Spurs.
• Projected points total: 53.8
• Projected rest of season total: 38.8 (9th)
• Market value: €521M (10th)
• Adjusted goal differential: +0.34 (6th)
Is this really it? Brighton have an older team than Manchester City so far this season, but a turn toward a peak-age roster hasn’t produced an upturn in results or performance. Given what we’ve seen from them in past years with possession-oriented managers and ace data-driven recruiting, I really want this team to be fun and exciting and good. Over the past two seasons, it feels like that only happens once or twice a month.
• Projected points total: 53.6
• Projected rest of season total: 41.6 (6th)
• Market value: €752M (6th)
• Adjusted goal differential: +0.25 (7th)
Put another one in the “just make Newcastle have the ball and you’ll win” basket after Sunday’s lopsided 3-1 loss to West Ham when Eddie Howe’s team had 62% of the ball:
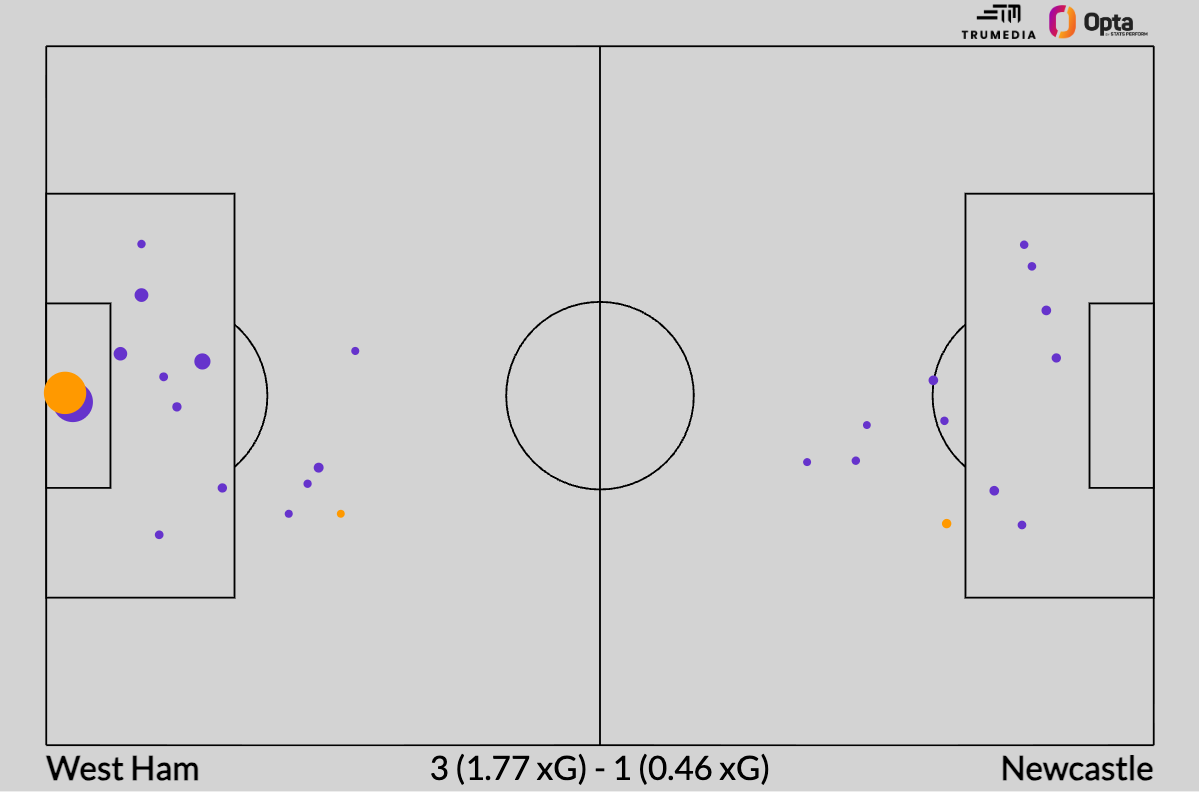
Coming into this weekend, Newcastle would’ve been my pick for “best team after the top four” from now until the end of the season — and they still might be. But, come on: this is West Ham, you guys! You’re in the Champions League! They’re old and bad!
Although 10th feels really low, the gap between Newcastle’s projection and Tottenham’s projection is smaller than the gap between Tottenham’s and Chelsea.
• Projected points total: 52.7
• Projected rest of season total: 34.7 (15th)
• Market value: €340M (18th)
• Adjusted goal differential: +0.01 (11th)
With matches against Arsenal, Liverpool and Manchester City among their next five, Sunderland probably aren’t going to hang around the top four much longer. But Sunderland are still hanging around the top four! You don’t need me to read you off the underlying numbers and tell you this is unsustainable, but the fact that Sunderland have played well enough to even be in the realm of some good fortune propping them up into the top four was close-to-unthinkable before the season started.
It might seem disappointing that they’re only projected to win the 15th-most points from here on out, but that number not being 19th- or 20th-most is a massive victory for a club that was favored to go right back down after getting promoted.
• Projected points total: 50.5
• Projected rest of season total: 35.5 (12th)
• Market value: €546M (9th)
• Adjusted goal differential: -0.42 (16th)
Villa are on the verge of becoming the Manchester United of the midtable: an expensive and theoretically talented squad with awful performances masked ever so slightly by not-quite-as-awful results. This is the second-oldest team in the league, too.
• Projected points total: 49.0
• Projected rest of season total: 36.0 (11th)
• Market value: €435M (13th)
• Adjusted goal differential: +0.02 (10th)
A warning to all: I’m going to write about Michael Kayode whenever given the chance. If “kicking a moving ball” was not the main component of soccer, then he would be the best player in the world. His throw-ins should be studied by NASA. He almost never loses any challenges in the air. And he’s a stompy, lumbering and somehow-effective dribbler. He just can’t pass very well.
• Projected points total: 46.8
• Projected rest of season total: 34.8 (14th)
• Market value: €415M (14th)
• Adjusted goal differential: -0.19 (13th)
When David Moyes was first with Everton, he was a Sir-Alex-Fergusonian figure who controlled everything at the club from lineups to signings to what ply toilet paper was used in the visitors’ locker room. Soccer has changed quite a bit since then, and I’m not sure how much of a say Moyes has on who his team are signing these days.
Why mention this? Well: Three of Everton’s major acquisitions this summer, Tyler Dibling, Thierno Barry and Adam Aznou, have combined to make three Premier League starts.
• Projected points total: 44.9
• Projected rest of season total: 33.9 (16th)
• Market value: €374M (17th)
• Adjusted goal differential: -0.25 (15th)
I had been waiting for Fulham’s strategy of not signing any promising young players who weren’t cast off by Arsenal to rear its head, and it feels like we finally might be there. This is the third oldest team in the league, and they’re starting to slip back down toward the relegation places after a few seasons of midtable consolidation.
The one saving grace, and the major weakness of these predictions: they don’t account for schedule strength. If we look at the adjusted goal differentials of a team’s opponents and where the games were played, Fulham have played the hardest schedule in the league so far.
• Projected points total: 44.2
• Projected rest of season total: 33.2 (17th)
• Market value: €316M (19th)
• Adjusted goal differential: -0.23 (14th)
Brenden Aaronson is second for Leeds in non-penalty expected goals and third in expected assists. Combine the two together, and he’s the team leader in expected attacking contribution. Is that good news for Aaronson? Bad news for Leeds? Possibly both?
• Projected points total: 41.5
• Projected rest of season total: 35.5 (13th)
• Market value: €645M (8th)
• Adjusted goal differential: -0.72 (18th)
Our basic model is essentially making the argument that Forest are too talented to get relegated. And that, too, would be the argument I’d make against Forest getting relegated.
Sean Dyche is a good manager and there should be enough competent players on this roster to find a collection that’ll make it work. But they’re four points from safety already, so there is now a non-zero chance that this team get relegated, win the Europa League, and play in both the Champions League and Championship next season.
• Projected points total: 38.8
• Projected rest of season total: 31.8 (19th)
• Market value: €401M (15th)
• Adjusted goal differential: -0.78 (19th)
Was the win over Newcastle a sign of progress under Nuno Espirito Santo? He changed up the base of his midfield completely, and perhaps that will make a material difference going forward. But even if it does, it’s hard to see this team doing anything other than fighting relegation from now until the end of the season.
• Projected points total: 37.8
• Projected rest of season total: 27.8 (20th)
• Market value: €247M (20th)
• Adjusted goal differential: -1.17 (20th)
They’ve somehow managed to win three games, but this is the worst-performing team in the league with the worst roster in the league. They’re bottom of the league in both expected goals for and against; they have the worst defense in the Premier League, and the worst offense in the Premier League.
Even with three wins, a draw and a three-point lead on 18th-place West Ham, Burnley surviving this season would shock me.
• Projected points total: 33.9
• Projected rest of season total: 31.9 (18th)
• Market value: €377M (16th)
• Adjusted goal differential: -0.69 (17th)
Here is a stat I couldn’t believe: Wolves, who are currently in 20th place, have a better xG differential than Tottenham, who are currently tied for fifth. As far as I’ve been told, though, actually kicking the ball into the goal plays a pretty important role in terms of how they determine the winner at the end of every game.
Given that not-terrible chance creation and suppression, the model sees Wolves winning more points than Burnley and West Ham from now until the end of the season. The problem: they still have zero wins and only two total points.